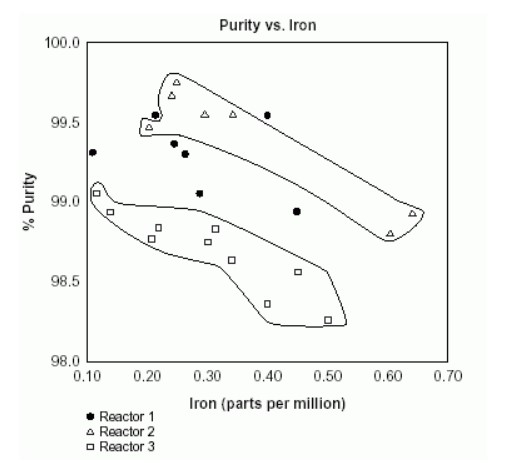
Stratification Diagram

The Stratification is a technique used in combination with other data analysis tools. When data from different sources or categories are combined, the meaning of the data can become invisible. This technique helps by separating the data so that patterns can be seen, allowing multiple subsets to be represented in a single diagram.
When to Use a Stratification Diagram
- Before collecting data
- When data comes from multiple sources, such as shifts, days of the week, suppliers, or population groups
- When data analysis requires separating different data sources
Grouping of data by common elements or characteristics, the thing that Stratification does, makes it easier to understand the data and draw insight from it.

