Management Systems World
All on Quality and other Standards in one place since 2010. Now Worldwide.
Pareto chart
A Pareto chart is used when you want to identify the relative importance of different details of a process (or group of errors) from a large number of various facts.
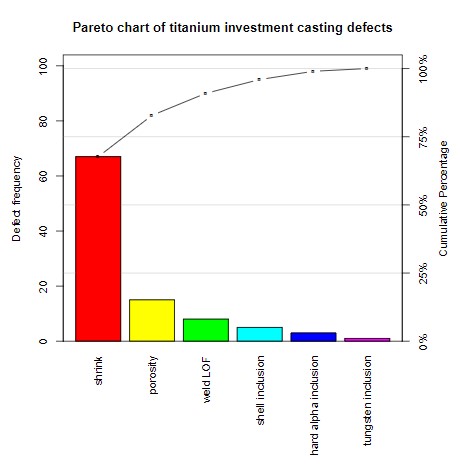
This chart serves to identify the most critical problems, uncover the causes of problems, etc. The Pareto chart often confirms the "80-20 rule" or "Pareto principle", which states that 80% of problems (errors) are caused by 20% of factors (causes). In practice, the 80-20 rule doesn't always apply absolutely; the ratio may be approximately (75-25, 70-30, etc.).
Image credit: By DanielPenfield - Own work, CC BY-SA 3.0
