Management Systems World
All on Quality and other Standards in one place since 2010. Now Worldwide.
Histogram
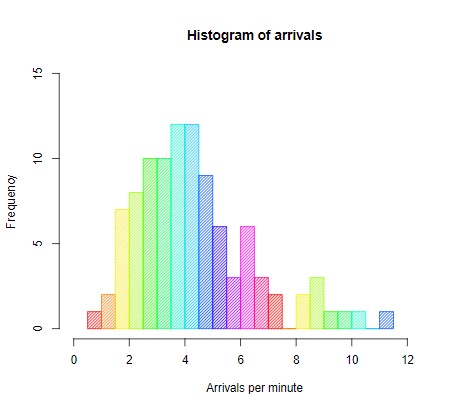
A Histogram is a tool that displays the distribution of errors, occurrences, and/or activities in a graphical form and is very easy to understand.
The histogram shows data according to their frequencies of occurrence. Each column represents one examined error (occurrence, activity). The height of the column represents the frequency of occurrence.
Histograms are beneficial because they display all values (including extremes), provide graphical (visual) information about a process (occurrence, activity), and help in making decisions about potential improvement opportunities.
Image credit: By DanielPenfield - Own work, CC BY-SA 3.0
