Management Systems World
All on Quality and other Standards in one place since 2010. Now Worldwide.
Ishikawa diagram (Fishbone diagram)
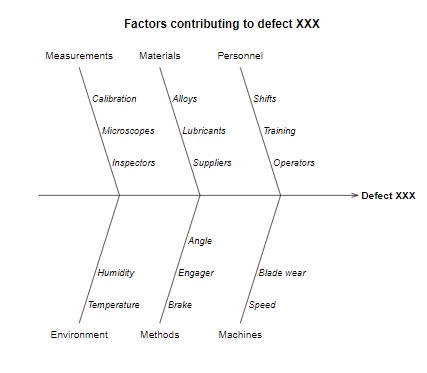
The Ishikawa diagram (Fishbone diagram) is also known as a Cause-and-effect diagram because it graphically shows the relationship between cause and effect in an extremely simple way.
Kaoru Ishikawa, a Japanese quality guru, developed these diagrams in the 1950s. It is used for systematically investigating all possible causes that make up an occurrence (process, activity, error). The result of a process is influenced by a multitude of factors between which causal relationships are not immediately visible.
This diagram provides a good basis for a complete analysis of the causes and effects of a phenomenon (error, problem).
Image credit: By DanielPenfield - Own work, CC BY-SA 3.0
