Management Systems World
All on Quality and other Standards in one place since 2010. Now Worldwide.
Gantt Chart
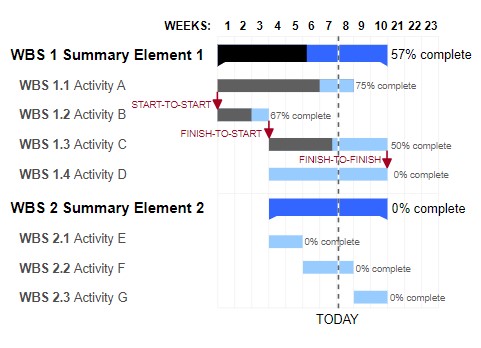
A Gantt chart is a type of bar chart that illustrates a project schedule.
It shows the start and end dates of individual project elements as well as their overview. Some Gantt charts also display the dependency relationships between activities (i.e., precedence network). Gantt charts can be used to present the current schedule of charts.
Image credit: By GanttChartAnatomy.png: Original uploader was Garrybooker
