Management Systems World
All on Quality and other Standards in one place since 2010. Now Worldwide.
100 quality tools in 200 minutes: How Fishbone Diagram Tackles Root Causes
September 25, 2024
You are not permitted to access this page. Please purchase membership to get full access to all articles or REGISTER TO GET 7 DAYS OF FREE ACCESS.
Register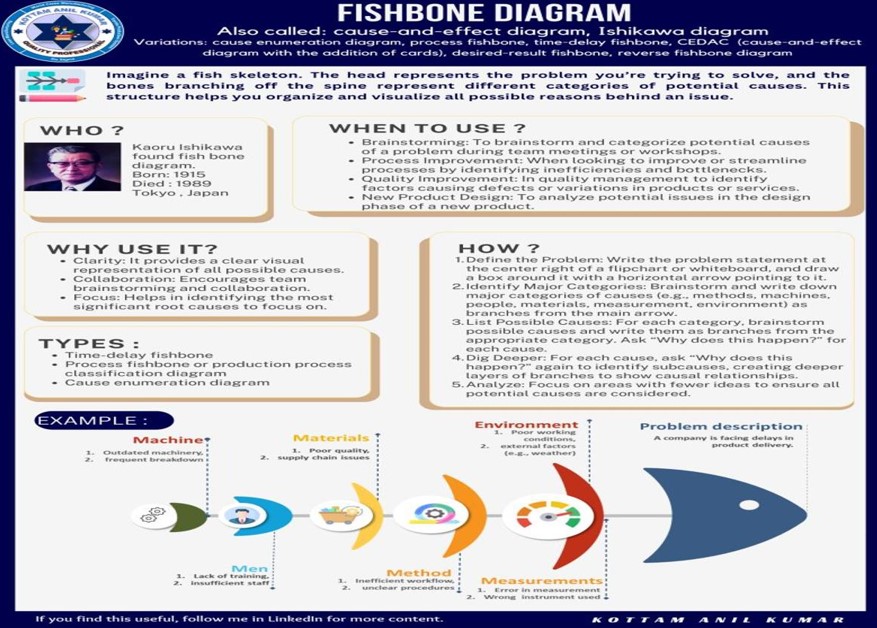
Source: Kottam Anil kumar
Kottam Anil Kumar shares his thoughts on the fishbone diagram, also known as the Ishikawa diagram, using an infographic he created to explain how this tool helps identify the root causes of problems.
Most popular blogs
-
Revised ISO 19011 Marks a Major Shift in How Modern Audits Are RunDecember 10, 2025Understanding the difference: standards, frameworks, laws, and regulationsAugust 20, 2024Understanding NDC in Measurement System Analysis - Automotive Quality SolutionsJuly 2, 2024Certification Bodies May Use Own Labs Under ISO 17065, But Only If Impartiality Is EnsuredJuly 8, 2025New Normal In Quality Shifts Focus From Order To Organizational ResilienceMarch 4, 2026Is DAkkS Applying Auditor Competence Rules Too Strictly?March 4, 2026ISO 9001 Can’t Save The Planet: Climate Change Expansion Weakens Quality PrinciplesMarch 4, 2026ISO 19011 Revision May Matter More Than ISO 9001 for Future AuditsMay 6, 2026Certifying Large Companies Requires A Different ApproachApril 15, 2026ISO 17025 Auditors Tread Thin Line Between Checking Compliance And AdvisingMarch 18, 2026
